Euro-Area Producer Prices Rose 8.2% and the Part Without Energy Keeps Climbing
Euro-area industrial producer prices rose 8.2% in the year to August 2026, the fastest rate since February 2023 (Eurostat, 5 October 2026). Producer prices are what factories charge at the gate, not what households pay at the till.
Seventy per cent of the headline is one input
Energy rose 21.0% over the year and carries roughly 27% of the index: 5.7 of the 8.2 percentage points, or 70% of the headline, is a single input. Of the acceleration from July’s 5.8%, energy explains 91%.
That weight is derived rather than published. It is back-solved from the release’s own identity and cross-checked against the index levels, which is why it is stated as roughly 27% rather than to a decimal.
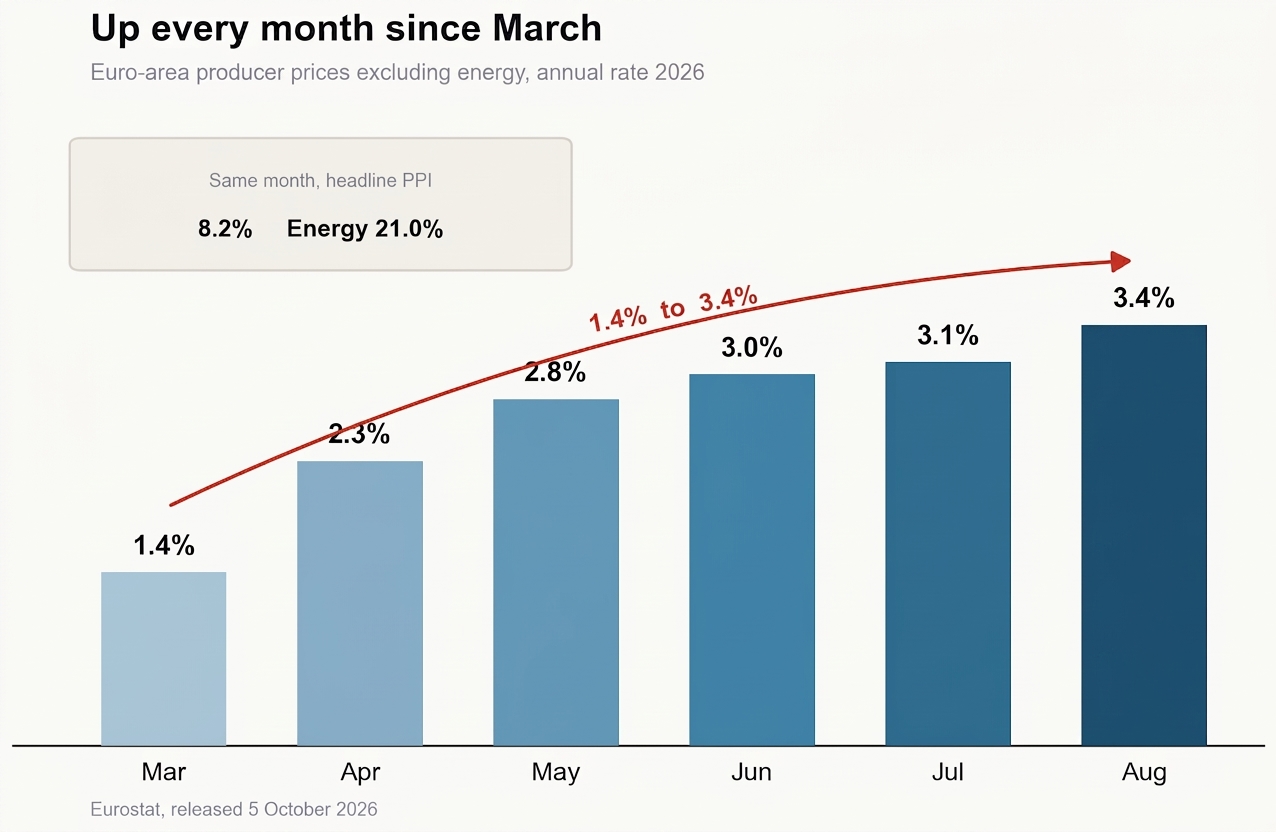
The part underneath has risen every month since March
Strip energy out and producer prices rose 3.4%. July was 3.1%, May 2.8%, March 1.4%. That series has risen in every month since March.
Consumer prices are doing it more quietly
Euro-area inflation hit 3.8% in September on the flash estimate, the first preliminary reading, up from 3.2% in August (Eurostat, 2 October 2026). Energy did most of it: 14.3% to 18.8%. Inflation excluding energy still rose, 2.1% to 2.3%, services 3.0% to 3.2%, unprocessed food 2.7% to 4.0%. Only non-energy industrial goods fell, 1.2% to 1.1%.
The ECB is not treating this as a pure energy story
The European Central Bank raised its deposit rate to 2.50% effective 16 September 2026, its second increase of the year, and projects inflation excluding energy and food at 2.5% for 2026, 2.6% for 2027 and 2.3% for 2028: above target in all three years, and revised up for the last two (ECB, 10 September 2026). It named second-round effects as the risk.
European benchmark gas passed €70 per megawatt-hour on 31 August 2026, the last day of the reference month (Euronews, 31 August 2026). That lands in September’s data, not August’s.
What the next two releases settle
September producer prices are not published until 5 November 2026, and September’s consumer figures stay estimates until 16 October 2026. Five months of ex-energy acceleration is a trend. Whether it is the energy shock broadening is a question those two releases answer, and this one cannot.