Europe Now Buys More Machinery Than It Sells
Europe’s exports added €7bn over eight months. Its imports added €130bn.
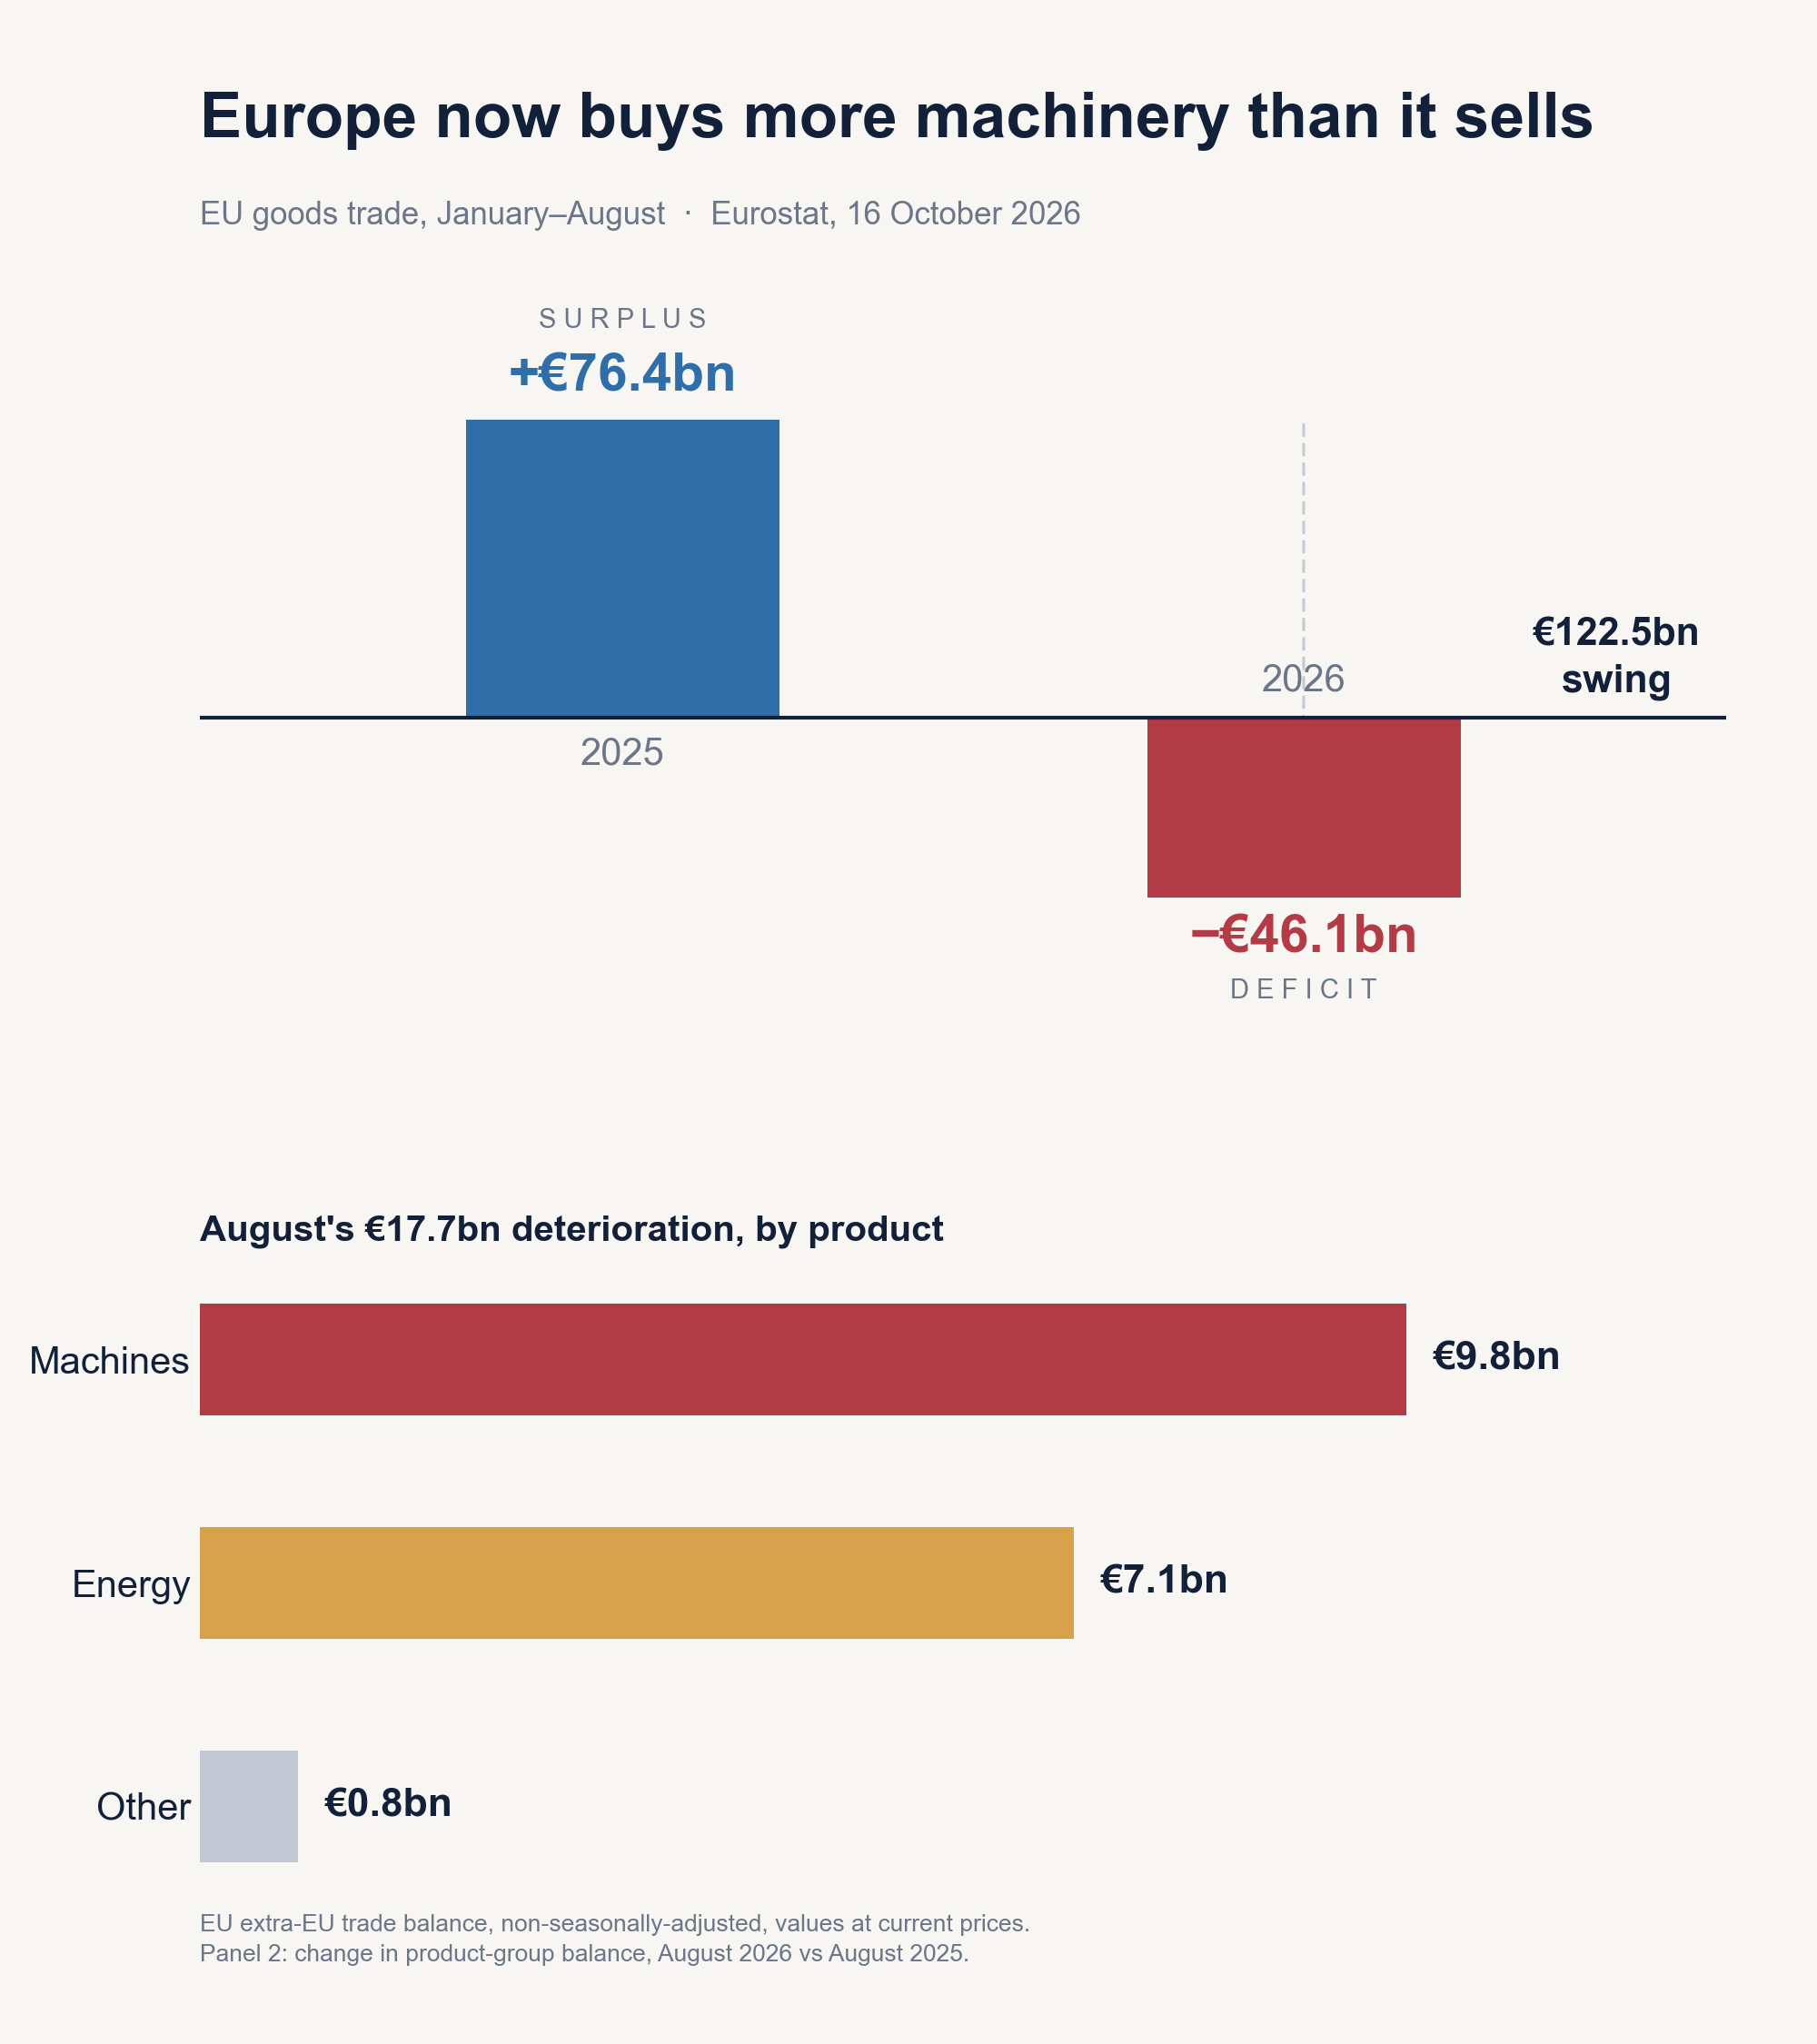
The surplus did not shrink, it inverted
Eurostat’s release of 16 October 2026 puts the EU’s January-August goods balance at a €46.1bn deficit, against a €76.4bn surplus in the same eight months of 2025: a swing of €122.5bn between the two periods.
The arithmetic underneath is lopsided. Extra-EU exports rose 0.4%, to €1,767.9bn. Imports rose 7.7%, to €1,814.0bn. In cash terms exports added about €7bn over the eight months while imports added about €130bn, which is the subtraction that produces the swing.
Both of those cash figures are my own derivation from the published levels and growth rates. Eurostat prints the levels and the percentages, not the differences.
Eurostat does not blame energy
The obvious suspect is the gas bill, and it is the wrong one. The release says August’s decline was “driven mainly by machinery and vehicles, the balance of which dropped from a €7.3 bn surplus to a €2.5 bn deficit”, and that the energy deficit “also widened”, from €24.3bn to €31.4bn.
The contributions line up with the wording. The EU balance deteriorated by €17.7bn in August against August 2025. Machinery and vehicles account for €9.8bn of that. Energy, €7.1bn. Everything else together, €0.8bn.
A European trade deficit led by machines rather than by energy is a different kind of problem from the one the continent has spent four years managing.
2022 was the other way round
The comparison worth making is the last time the EU’s goods balance collapsed. In January-August 2022 the balance fell to a €309.6bn deficit from a €91.8bn surplus a year earlier, and the energy balance did almost all of it: from minus €152.5bn to minus €423.4bn (Eurostat, 14 October 2022).
Machinery and vehicles over those same months still earned a surplus of €73.5bn. It had fallen from €115.2bn, so it was shrinking. It was not negative.
That is the whole difference. In 2022 the bill was enormous and the export engine still worked. The engine is the part that changed.
One limit on this comparison: the 2026 product breakdown published in the October release covers August alone, while the 2022 release publishes January-August product balances. The contrast is therefore about the sign of the machinery line, not a like-for-like comparison of each year’s shares.
What is left of the manufacturing surplus
The EU still runs a surplus in manufactured goods, and it is thin. August’s figure is €3.1bn, down from €14.6bn a year earlier. Chemicals alone contribute €14.1bn of it, which means the rest of manufacturing is a net drag.
Tariffs are part of it, China is more of it
US tariffs belong in this story, but not as the explanation. EU exports to the United States fell 30.4% year on year in the first quarter of 2026 (Eurostat, 28 May 2026), the sharpest drop to any partner. August was better, with exports up 18.5% and the bilateral surplus widening to €8.6bn, though that improvement comes off a badly depressed base.
The larger single line is China. The EU’s deficit with China was €38.4bn in August alone, against €30.1bn in August 2025.
What would reverse, and what would not
These are values at current prices, not volumes, and they are not seasonally adjusted. The adjusted series matters here: on it, the euro area’s August deficit is €6.8bn rather than the €16.1bn headline. Eurostat publishes that adjustment for the euro area, not for the EU.
Part of the rest is simply the gas price. Dutch TTF settled at €88.41/MWh on 19 October 2026 against roughly €32/MWh a year earlier. A mild winter would close some of the gap without anything changing in European industry.
August 2026 is also a provisional first estimate measured against revised history, and Eurostat revises these for up to two years. August 2025 has already moved from a €1.0bn surplus at first estimate to a €1.7bn deficit today. That price can fall back, and these figures can move.